Residents in Hartford’s Northeast and Upper Albany areas lead shorter and sicker lives than people in the West End.
African American and Hispanic males in New Haven’s poor neighborhoods are at greater risk of being murdered than residents a few blocks away.
The stigma of teenage pregnancy keeps girls in Groton’s Fieldcrest neighborhood from seeking first-trimester prenatal care, even when services are readily available.
Local public health officials and health care providers are zeroing in on health disparities by using the “health equity index,” an online tool to measure the correlation between health and the socioeconomic factors that define a community.
The tool is changing the way experts approach public health concerns from obesity, heart disease and diabetes to sexually transmitted diseases, homicide and depression by examining the root causes of poor health.
They hope to use data from the index to promote initiatives – from outreach efforts to bring medical services to a community to programs to help residents shop for healthy food to re-thinking housing policies that promote disease – that address health inequities.
“We as a nation and state have done little to change the course of health disparities. If we really want to address health inequities, we must begin by critically looking at the impact of social conditions on a population’s overall health,” said Jennifer Kertanis, who until recently was executive director of the Connecticut Association of Directors of Health (CADH), a nonprofit agency that developed the index.
How The Health Equity Index Works
In Connecticut, health disparities are well documented among African Americans and Hispanics, compared with their white counterparts. Health disparities refer to gaps in health outcomes and access to health care across racial, ethnic and socioeconomic groups.
“Everybody should have the same opportunity to be healthy, no matter where they live or what their socioeconomic status,” said Russell Melmed, an epidemiologist with the Ledge Light Health District, which serves New London and four surrounding communities.
The index gathers information from multiple sources to measure seven “social determinants” – economic security, employment, housing, education, community safety, civic involvement and environmental quality – and their correlation to 13 specific health outcomes, including cancer, respiratory illness, childhood illness, kidney and liver disease, health care access and more. While some connections seem apparent, such as the link between income and educational attainment to poor health, other findings are subtler, such as the correlation between industrial pollution and sexually transmitted diseases.
The index generates community-specific scores ranging from one for “poor” to 10 for “excellent” for each social determinant and health outcome. The scores can be displayed on geographic information system (GIS) maps that graphically depict neighborhood disparities block-by-block. (To view a map click here.)
“There’s real power to seeing the GIS maps, especially if the disparities are stark,” said Melmed, who uses the maps at town meetings.
Reaching Vulnerable Communities
At Saint Francis Hospital and Medical Center in Hartford, health care professionals are using the index to better deliver services to people such as Karin Astorga of Glastonbury, a former Hartford resident, whose two children have relied on the hospital’s Pediatric and Adolescent Medicine Clinic.

Leslye Smith Photos
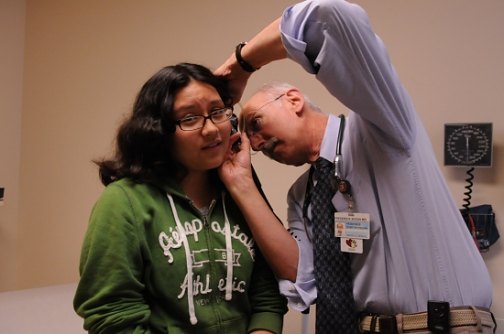
Karin Gonzalez, 12, of Glastonbury is examined by Dr. Frederick Bogin, medical director of the Pediatric and Adolescent Medicine Clinic at Saint Francis Hospital and Medical Center, which is using the index to better serve its patients.
“I’m not sure what we would do without this place,” said Astorga, whose children are insured through the state-subsidized HUSKY program. Located on the hospital campus, the clinic handles about 17,000 visits a year, mostly patients from Hartford, where nearly a third of all families live in poverty.
“You can’t talk about the health care needs of a vulnerable population without identifying the social, economic and other barriers that prevent people from seeking care,” said Dr. Adam Silverman, a primary care physician and consultant at Saint Francis.
“It’s hard to discuss medications or nutritional counseling with patients who are worried about feeding their families or telling us they don’t have clean air, clean water or enough housing in their community.”
In Hartford, high poverty, unemployment and crime rates coupled with low educational attainment, sub par housing and a blighted environment contribute to poor life expectancy and health outcomes, particularly among African Americans and Hispanics, according to “Healthy Hartford,” a community health needs assessment published by the Hartford Department of Health and Human Services this spring. The report used the health equity index, among other tools, to examine the city’s 17 neighborhoods.
“The findings show how poverty has such a real impact on people’s lives and their health,” said Otis Pitts, an epidemiologist with the Hartford Department of Health and Human Services who also lives in Hartford. And while the index can’t prove “direct cause and effect relationships,” added Silverman, it can show how “socioeconomic factors can promote wellness or illness.”
Within the index, Northeast and Upper Albany rated the lowest of all Hartford neighborhoods for years of potential life lost – an estimate of the average years they would have lived if they hadn’t died prematurely. High infant and neonatal death rates contribute to lower-than-average life expectancy in Hartford. Northeast residents also are at greater risk for developing cardiovascular disease, diabetes and infectious diseases. West End and Parkville residents are more likely to suffer from respiratory illness. The Frog Hollow and Clay-Arsenal neighborhoods are the hardest hit by poverty.
For Pitts, the reasons for poor health outcomes often go beyond access to medical services and health insurance. “Relatively manageable conditions such as chlamydia and gonorrhea, for example, can serve as markers for people who are living in the shadows of society, taking risks due to the loss of hope,” he said. “They don’t believe they have opportunities to advance and pursue the American Dream. As a result, they are more likely to put themselves at risk for things like sexually transmitted diseases.”
Community Violence Impacts Health
In New Haven, health officials used the index and other resources to examine the public health implications of violent crime, including homicides, assaults and the onset of depression and cardiovascular disease from the stress of living in unsafe communities.
“The health equity index helped us to understand as a community why violence is a significant public health concern,” said Amanda Durante, chair of the city’s Health Equity Alliance and an epidemiologist at the New Haven Health Department, which last year published “Creating a Healthy and Safe City: The Impact of Violence in New Haven.”
Among the report’s findings: The city’s composite index score for economic security, employment and education were poor, with young African American and Hispanic men living in a concentrated area shouldering the burden of poor health outcomes. Assaults were the leading cause of death for men ages 15 to 39, accounting for 38 percent of the deaths among African American and Hispanic males in this age group.
At least 75 percent of all violent crimes occurred in just 20 percent of the city’s area. Census tracts in Dixwell, Newhallville, Wooster Square/Mill River and portions of downtown, Fair Haven and the Hill had the highest rates of violent crimes. Dwight, Edgewood, West River, Long Wharf and other parts of downtown, East Rock, Fair Haven and the Hill also had “elevated” rates of violent crime.
Transforming Rural Communities

Leslye Smith Photo
Dr. Silverman
Expect to hear more about the index in the future as health care reform focuses on keeping people healthy with preventive and primary care services as a way to contain costs, experts said. “We need to find ways to engage communities to take better care of themselves,” said Silverman.
In rural areas, health officials are using the index to assess health care needs in Litchfield, New London, Tolland, Windham and Middlesex counties thanks to federal “community transformation” grants ($494,000 a year for the next five years) to tackle chronic disease and health inequities. CADH has obtained a grant that will make the health equity index available to all local health districts and local departments through March 2013.
“Folks living in rural areas experience health disparities just as much as those in urban areas,” said Renee Coleman-Mitchell, section chief of health education, management and surveillance for the state Department of Public Health. “But rural communities often times are overlooked because they’re located within large geographic regions that have smaller populations.”
In Litchfield County, James Rokos, director of the Torrington Area Health District, which covers 20 towns, predicts the health needs assessments will be an “eye-opening experience” that sheds light on its poorer residents.
“Litchfield County is known for having many wealthy communities,” he said, “but the county has its share of poor people, too.”
Too bad that one has to apply on behalf of a professional organization to access the data. It would be nice if it were open to the public. “Community-based electronic tool” is a bit of a misnomer if the communities themselves can’t get access.
Couldn’t agree with Robn more. Public access can be facilitate most easily when basic pivot tables can be provided by the State Health Dept. See the website of Colorado Commission for Affordable Health Care, the tab labeled “Public Input”. See the recommendation under “Data Transparency”. Also, see the many examples of pivot tables, including one created from a download of “County Health Rankings”. Anyone can select their county and see how they stand compared to quintiles of over 3,000 counties in the USA. These are basic indicators for a “Health Equity Index”, generally accepted elements for achieving the objectives of Triple Aim (population health, quality patient care and affordable access to care). Contact me to discuss more (iplus007@gmail.com)